Use cases / Methane detection
Detecting and quantifying methane sources in a complex multi-emission site under high winds.
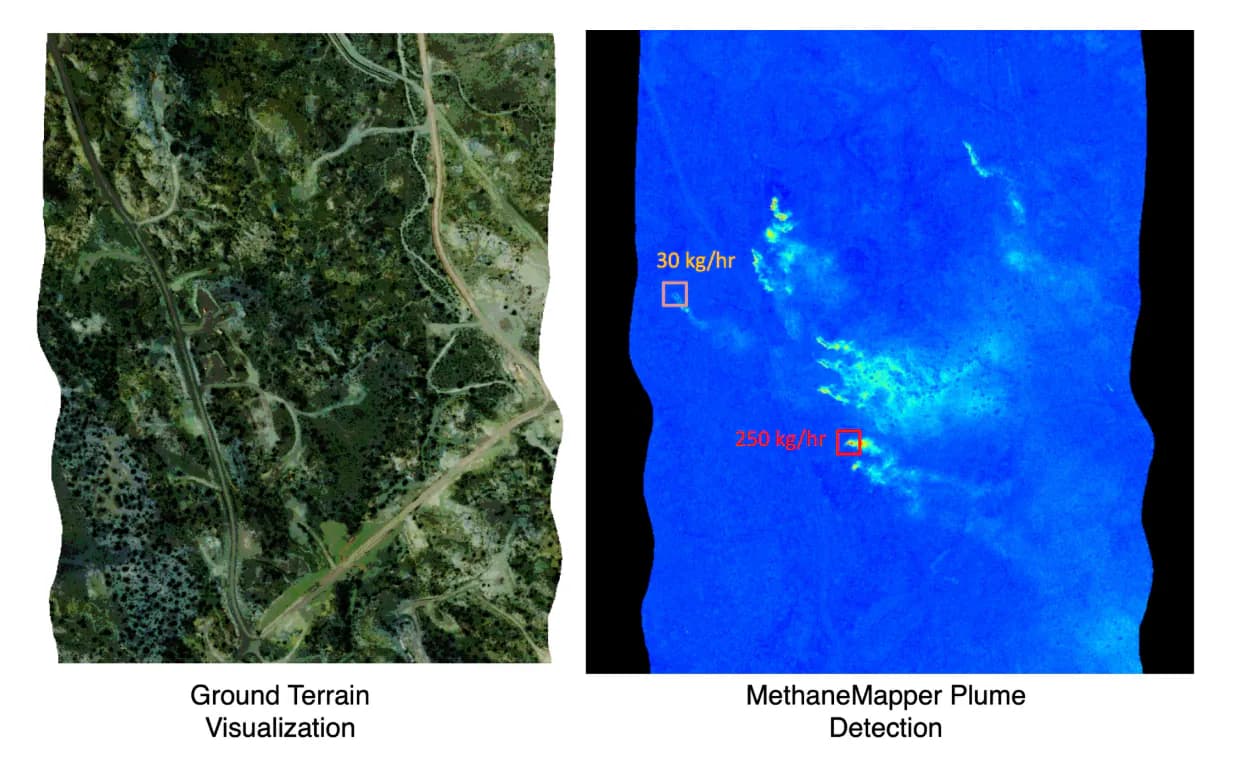
Evaluating MethaneMapper on NASA JPL's AVIRIS-NG hyperspectral data. 426 spectral bands, 25 km flight line, multiple overlapping plumes, 4+ m/s winds.
25km
Flight line
426
Spectral bands
<4min
Processing time
30–250kg/h
Emissions detected
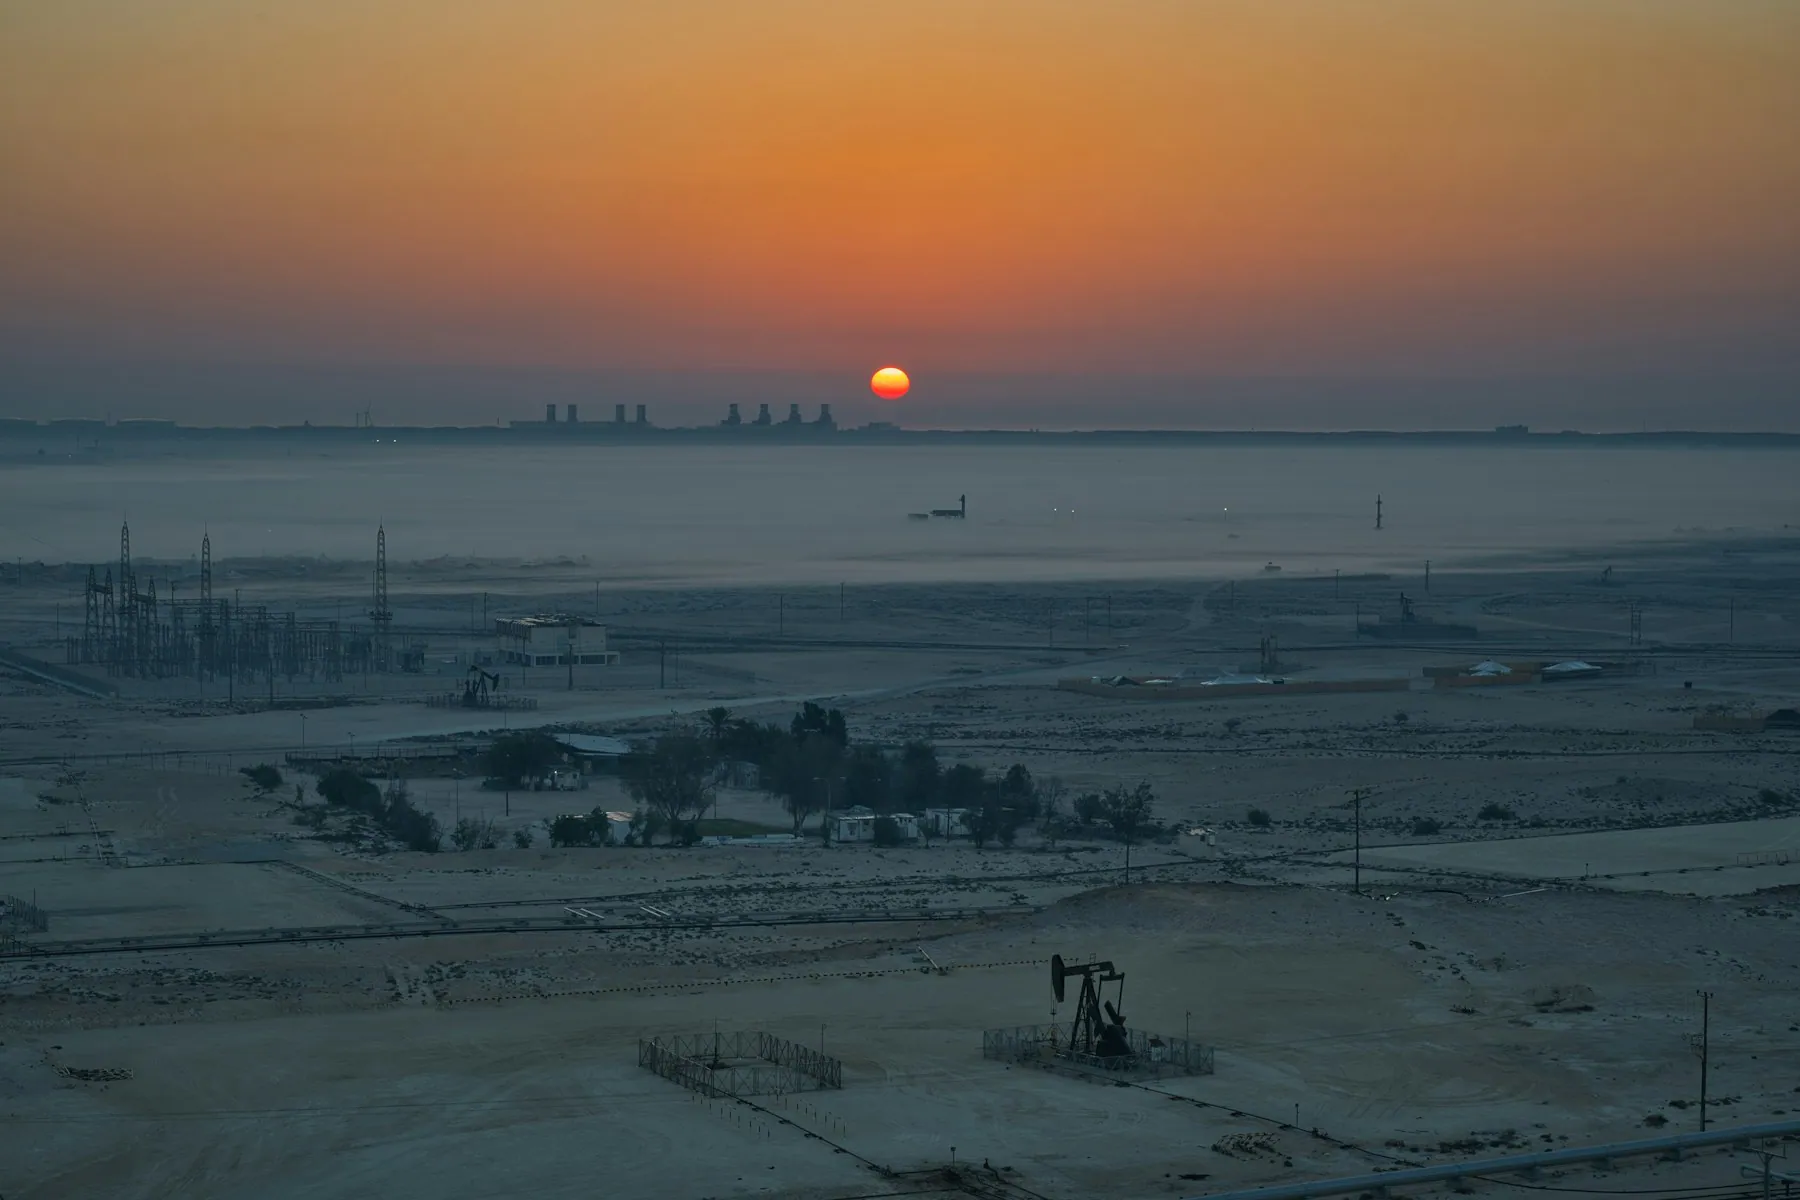
AVIRIS-NG hyperspectral capture · methane plume signatures
Contents
Context
We collaborated on methane analysis using AVIRIS-NG, NASA Jet Propulsion Laboratory's airborne hyperspectral sensor. The dataset was shared with us by Sarah Ludreen and provided a high-resolution spectral view across 426 channels, spanning wavelengths from 400 nm to 2400 nm — visible to short-wave infrared.
This case study focused on evaluating the performance of our proprietary algorithm, MethaneMapper, on a highly complex airborne dataset designed to test both detection sensitivity and source separation under difficult real-world conditions.
Challenge
Airborne methane analysis becomes significantly more difficult when:
In this dataset, the site contained several nearby emission points under wind speeds greater than 4 m/s — one of the more challenging scenarios for methane detection and attribution.
- →Multiple emission sources are located close to one another
- →Plume signatures overlap spatially
- →Strong winds disperse methane rapidly
The key challenge was not only to detect methane presence, but to correctly distinguish each individual source and quantify emissions accurately despite plume interference and wind-driven dispersion.
Solution
We applied MethaneMapper to the AVIRIS-NG hyperspectral dataset and processed a 25 km flight line using our high-speed methane analytics pipeline.
Leveraging the rich spectral information captured across 426 bands, MethaneMapper was able to:
The full dataset for the 25 km flight line was processed in under 4 minutes, demonstrating speed and operational efficiency on computationally demanding hyperspectral data.
- 01Isolate methane signatures from background signals
- 02Separate closely spaced emission plumes
- 03Identify each individual emission source
- 04Quantify emissions for each source independently
Results
MethaneMapper successfully detected and quantified individual emission sources in a complex, high-wind environment where multiple nearby leaks were present.
01 / Detection
Source-level
Accurate detection in a multi-emission scenario with overlapping plumes.
02 / Conditions
>4m/s
Successful operation under strong wind dispersion.
03 / Range
30–250kg/h
Quantified emissions across an order of magnitude.
04 / Speed
<4min
Processing of full 25 km flight line.
This case study highlights MethaneMapper's ability to deliver fast and precise methane intelligence even in difficult sensing conditions — making it a strong solution for advanced airborne monitoring workflows.